explain.ai
Application UI and
Visual Design
Early Concept
Multi-Cloud Security Platform UX / UI Concept 2021 - 2022
My ROLE
Freelance UX / Visual Designer
TOOLS
Figma, Miro, Sketching, Paper Prototyping,
DELIVERABLES
Hi-Fi UI Screen-flows per Use Cases.
Basic Click-through Prototype.
Competitive Analysis.
Initial User Research / Personas.
GOALS
Provide a feasible, Proof-of-concept Application UI visualization for my client’s pitch presentations. Translating his abstract business logic & concepts to concrete UI screens, screen-flows to support him to gain Buy-Ins / potential investors. Early Logotype / Corporate Identity design.
Introduction
explain.ai is an intelligent ai driven, temporal network graph analytical engine. Detects, Explains, Visualise, Remediates threats in Virtual Cloud Networks.
Agent-less, Multi-Cloud Security Platform which integrates distinct tools, data sources, and methods in a single SaaS application. The Application detects, threats and compliance violations in near real-time. Explains to End-Users the origin and propagation of threats across multiple vectors such as user behavior, machine communications, application Interactions. Continuously assures Access Policies and application interactions. Reduces time to detect, analyze, and reduce the cost of a breach. The application ingests temporal cloud network logs and other data. The data is processed by the application not only offering threat detection but remediation as well.
Problems - Design Topics
How to visualize virtual cloud network communications in a meaningful manner for end-users, enabling him/her to pinpoint problems immediately?
How to offer contextual suggestions to eliminate the threats?
How to enable end-user to look through suspicious activities in a cloud network’s communication history -within a user-defined time range and be able to act upon those threats right away?
How to manage pre-canned solutions to eliminate reoccurring typical threats?
How to choose/apply those pre-canned solutions when a threat is detected?
How to manage multiple, monitored Virtual Private Clouds within the application?
How add a new VPC to the system?
How to manage, add new or disable existing data source to an existing, already ingested VPC?
And a lot more unclear questions and problems…
explain.ai Logotype
Logotype “PackMan” concept.
The app is eating up all the malicious threats…
Branded Login Screen
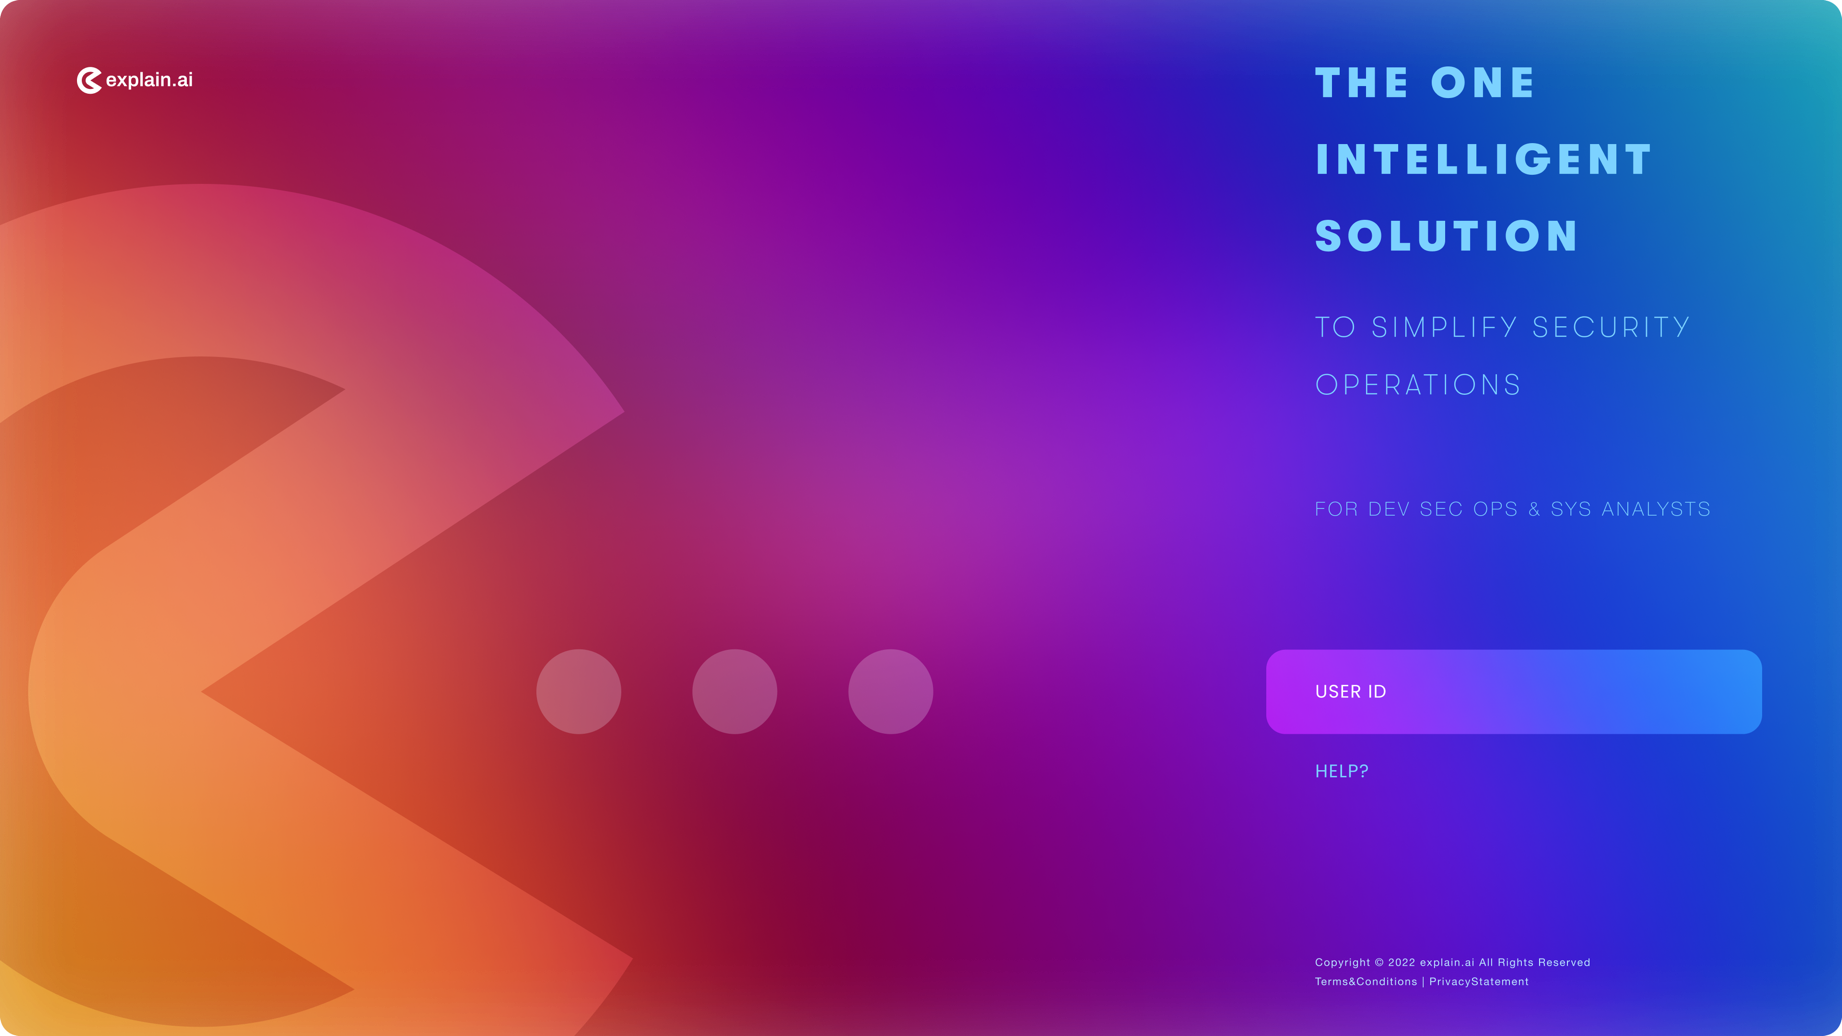
Branded front page with simple sequential login to access the application.
Application Performance Overview Screen
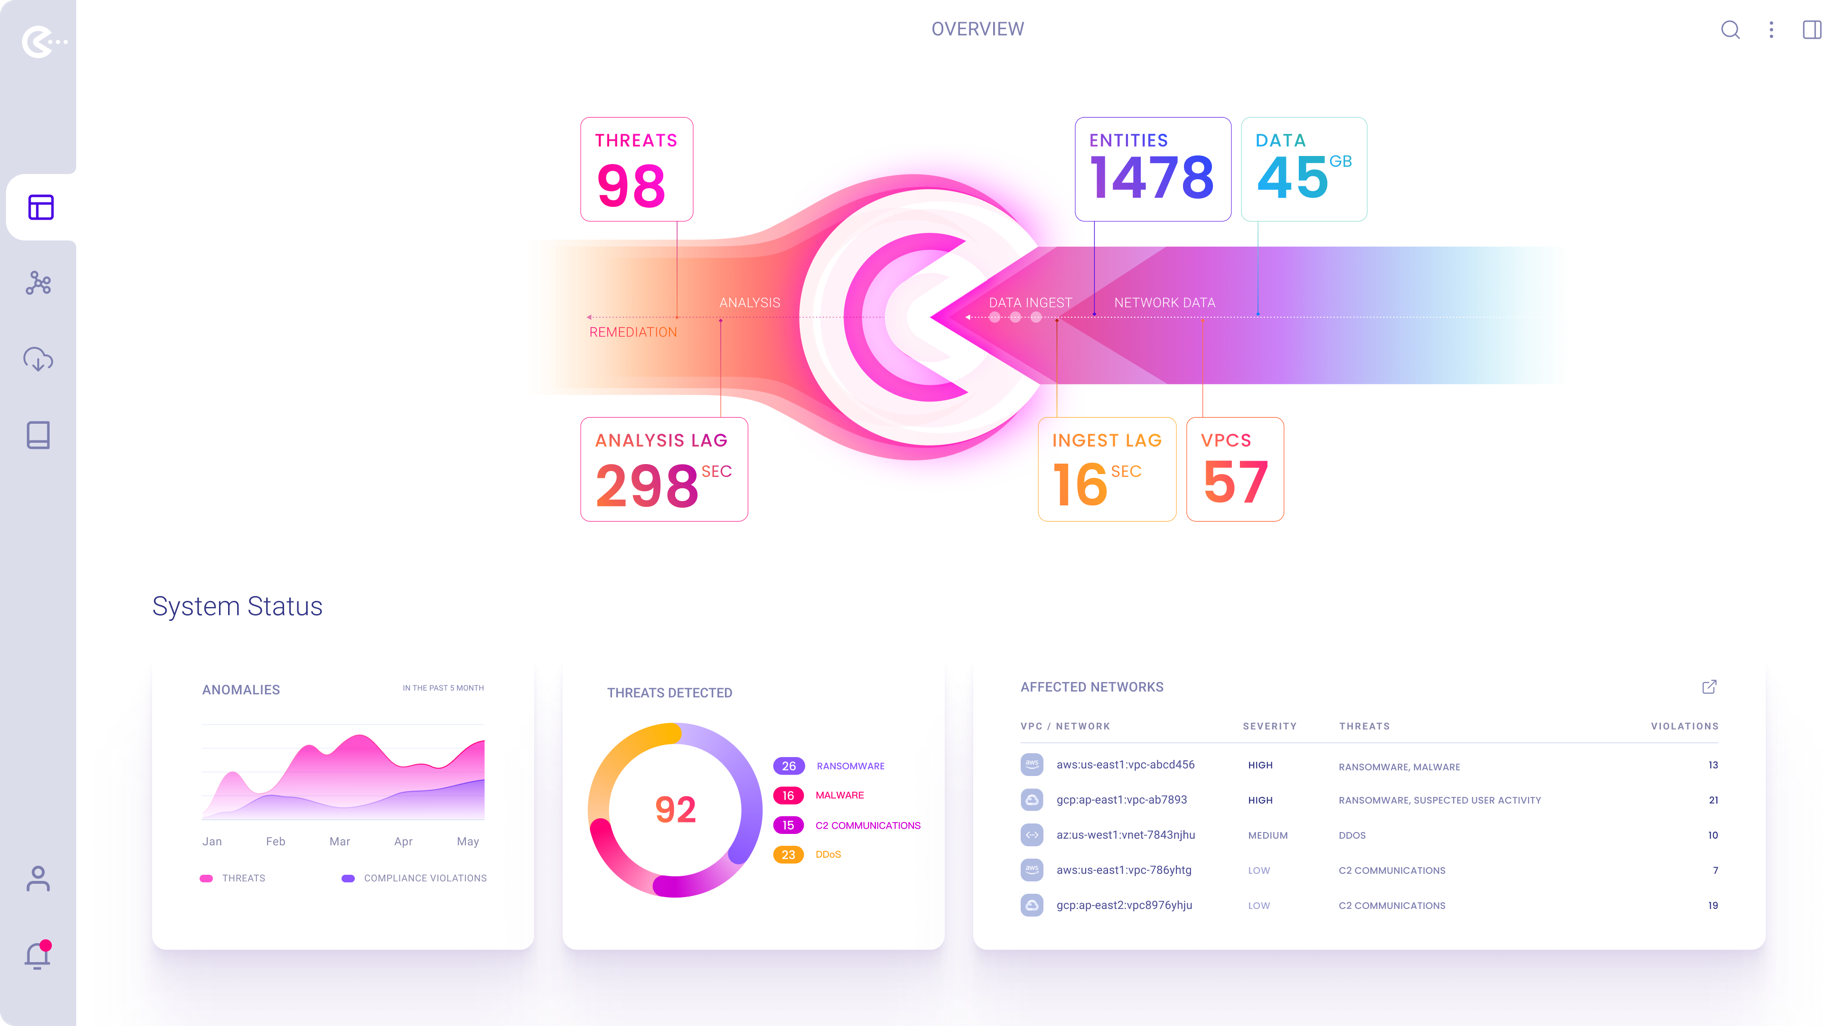
Application Status / Performance Overview Screen
Contains a list of affected networks currently ingested by the system. Users can launch a VPC for analysis/remediation from the prioritized list.
After log in, a user would land on the last opened graph if wasn’t closed or if there was any.
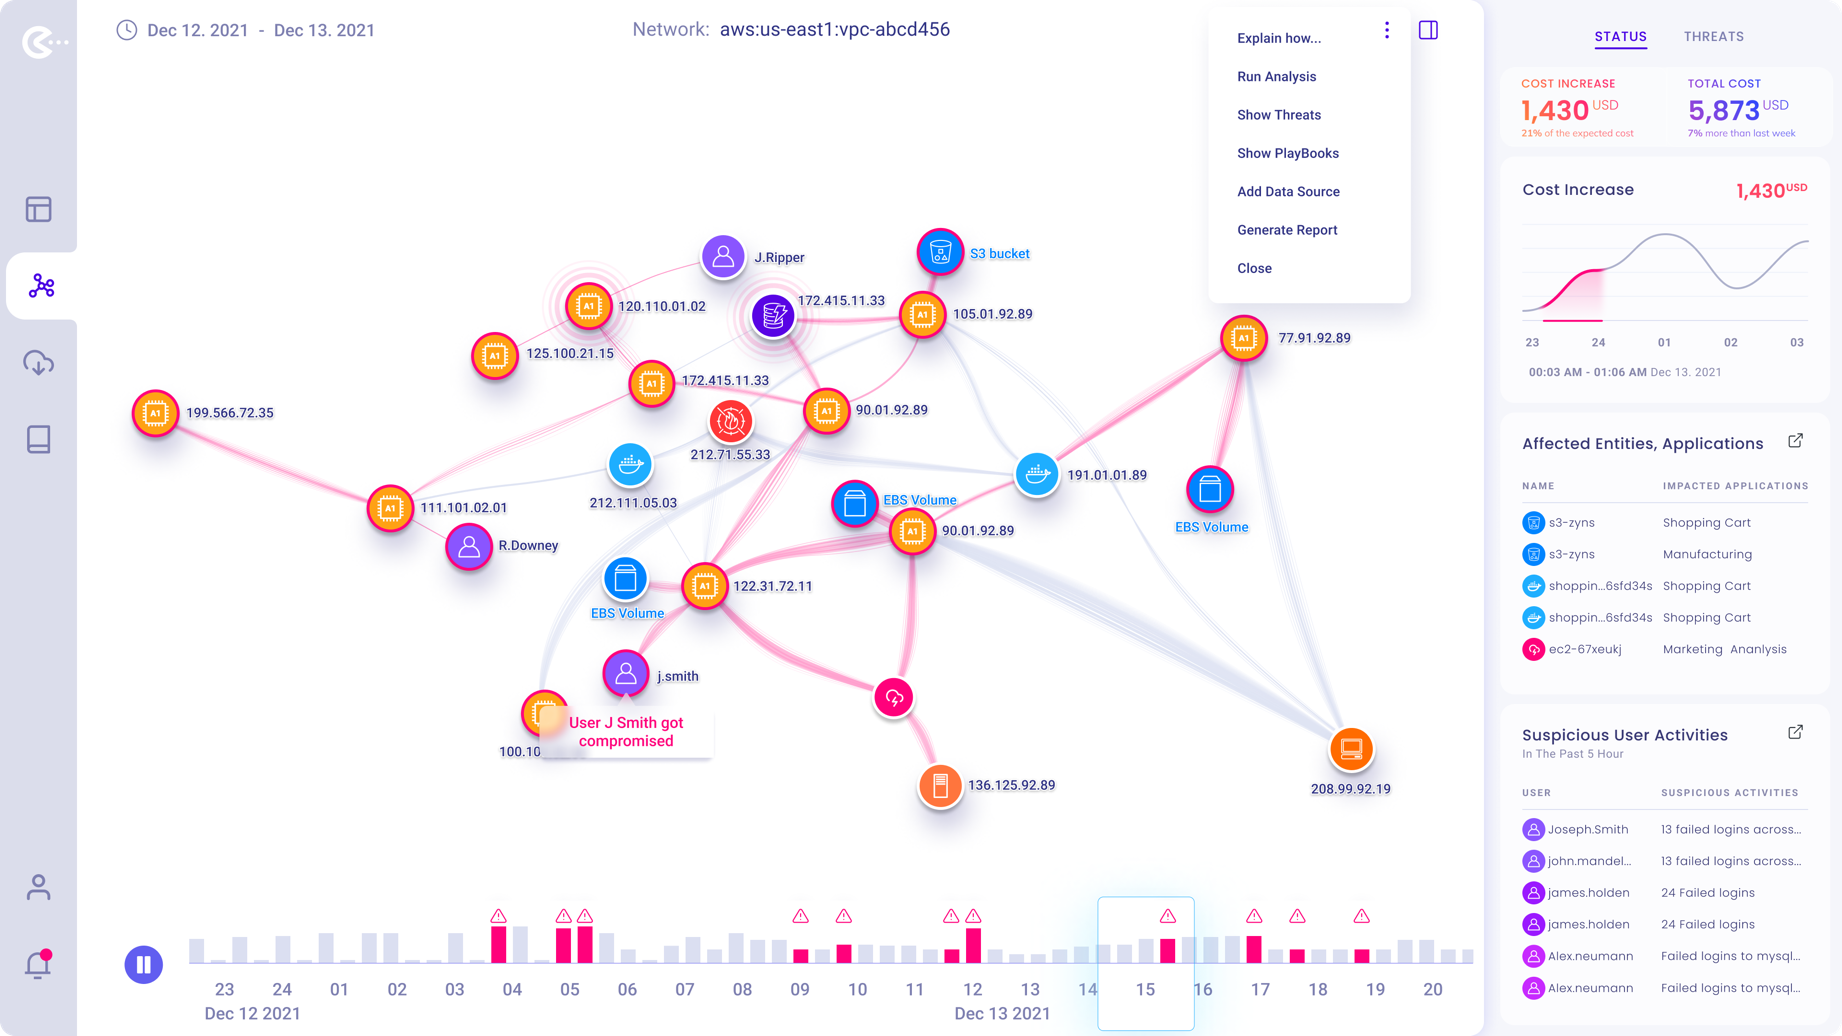
VPC Management Screen
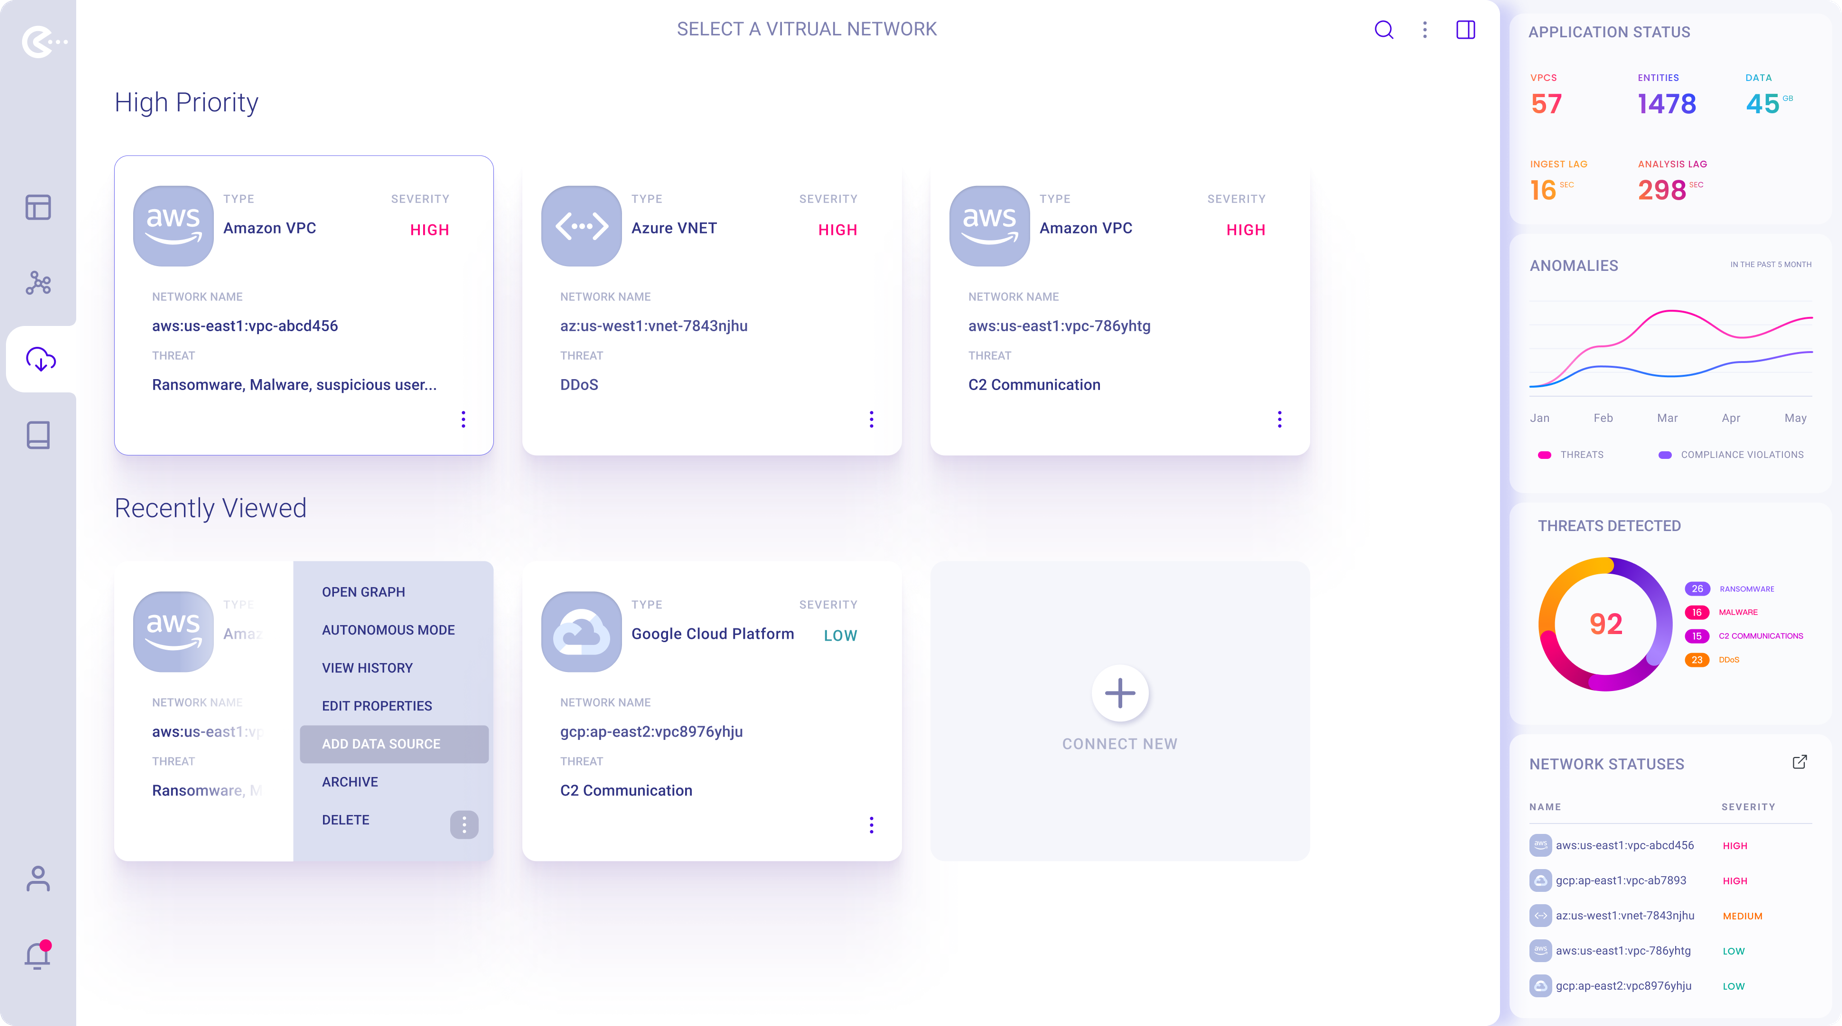
Tab selected screen where User can choose if wants to address new high priority threats or continue monitoring graphs previously worked on.
Also can add a new VPC to be monitored.
The right-hand side panel displays performance-related statistical data and high-priority threats detected.
VPC Graph menu
Application Menu for a selected VPC Network Graph.
Add / Manage Datasources current used by the selected Virtual Private Cloud.
Datasources Management Panel
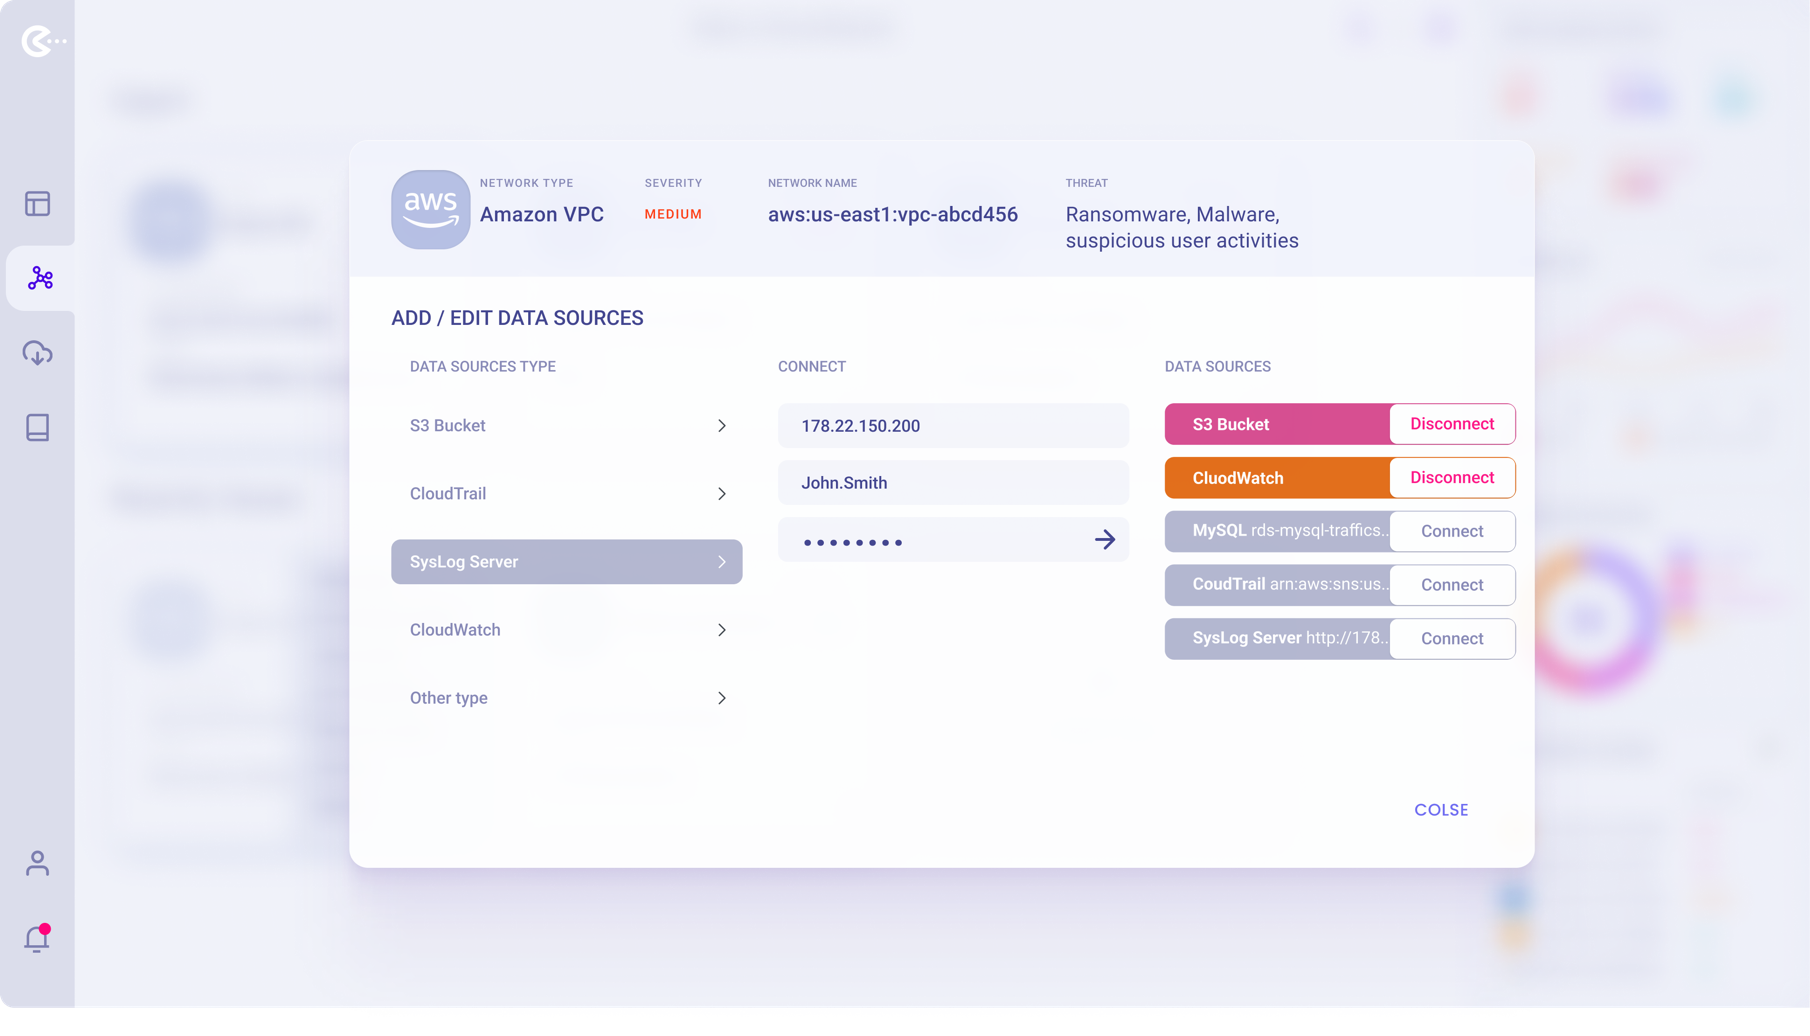
Modal Panel to manage Datasources.
Add/enable/disable Datasources used by the currently selected Virtual Private Cloud.
Threats remediation process
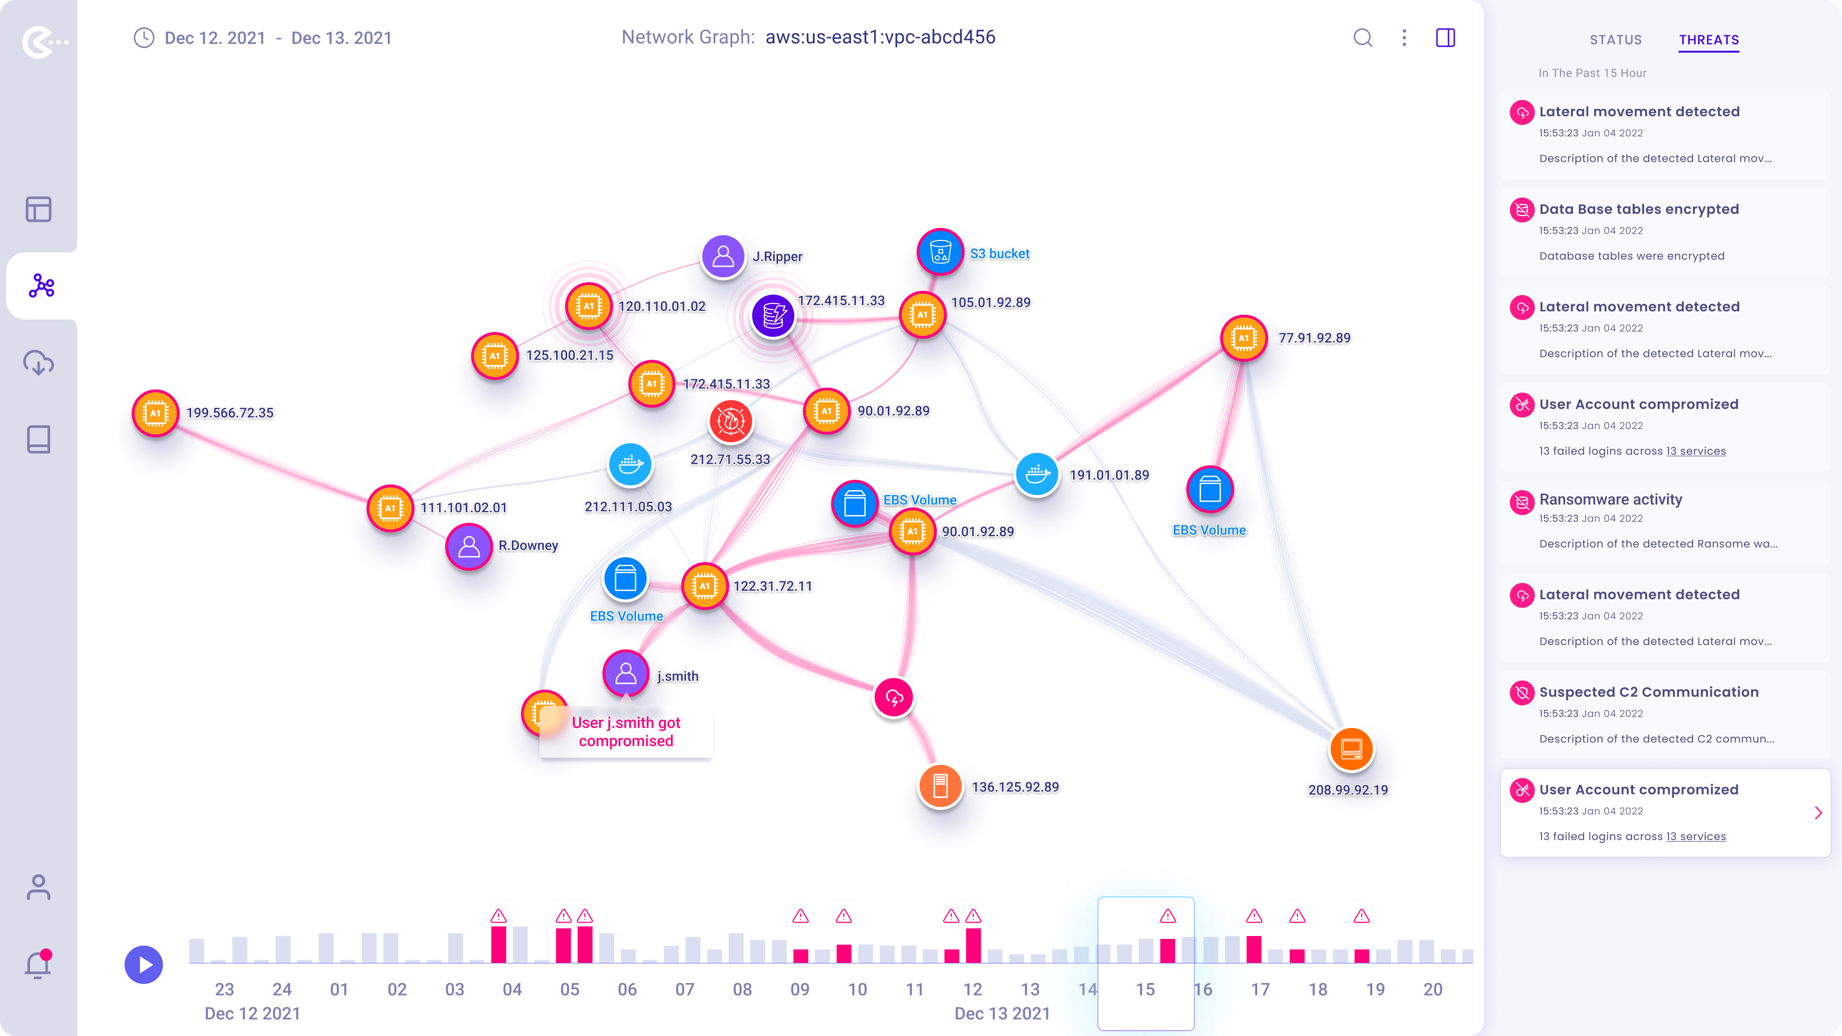
By either selecting the “Threats” tab in the right-hand side panel or clicking on a compromised “Node” within the graph, the user can start the remediation process for the affected network.
In the right-side panel, chronologically all detected threats are listed. Clicking on a threat will initiate threat elimination.
Using the timeline below the graph, users can jump to any called out “Suspicious Activity”
In time within the displayed time range.
Threat details and suggested actions
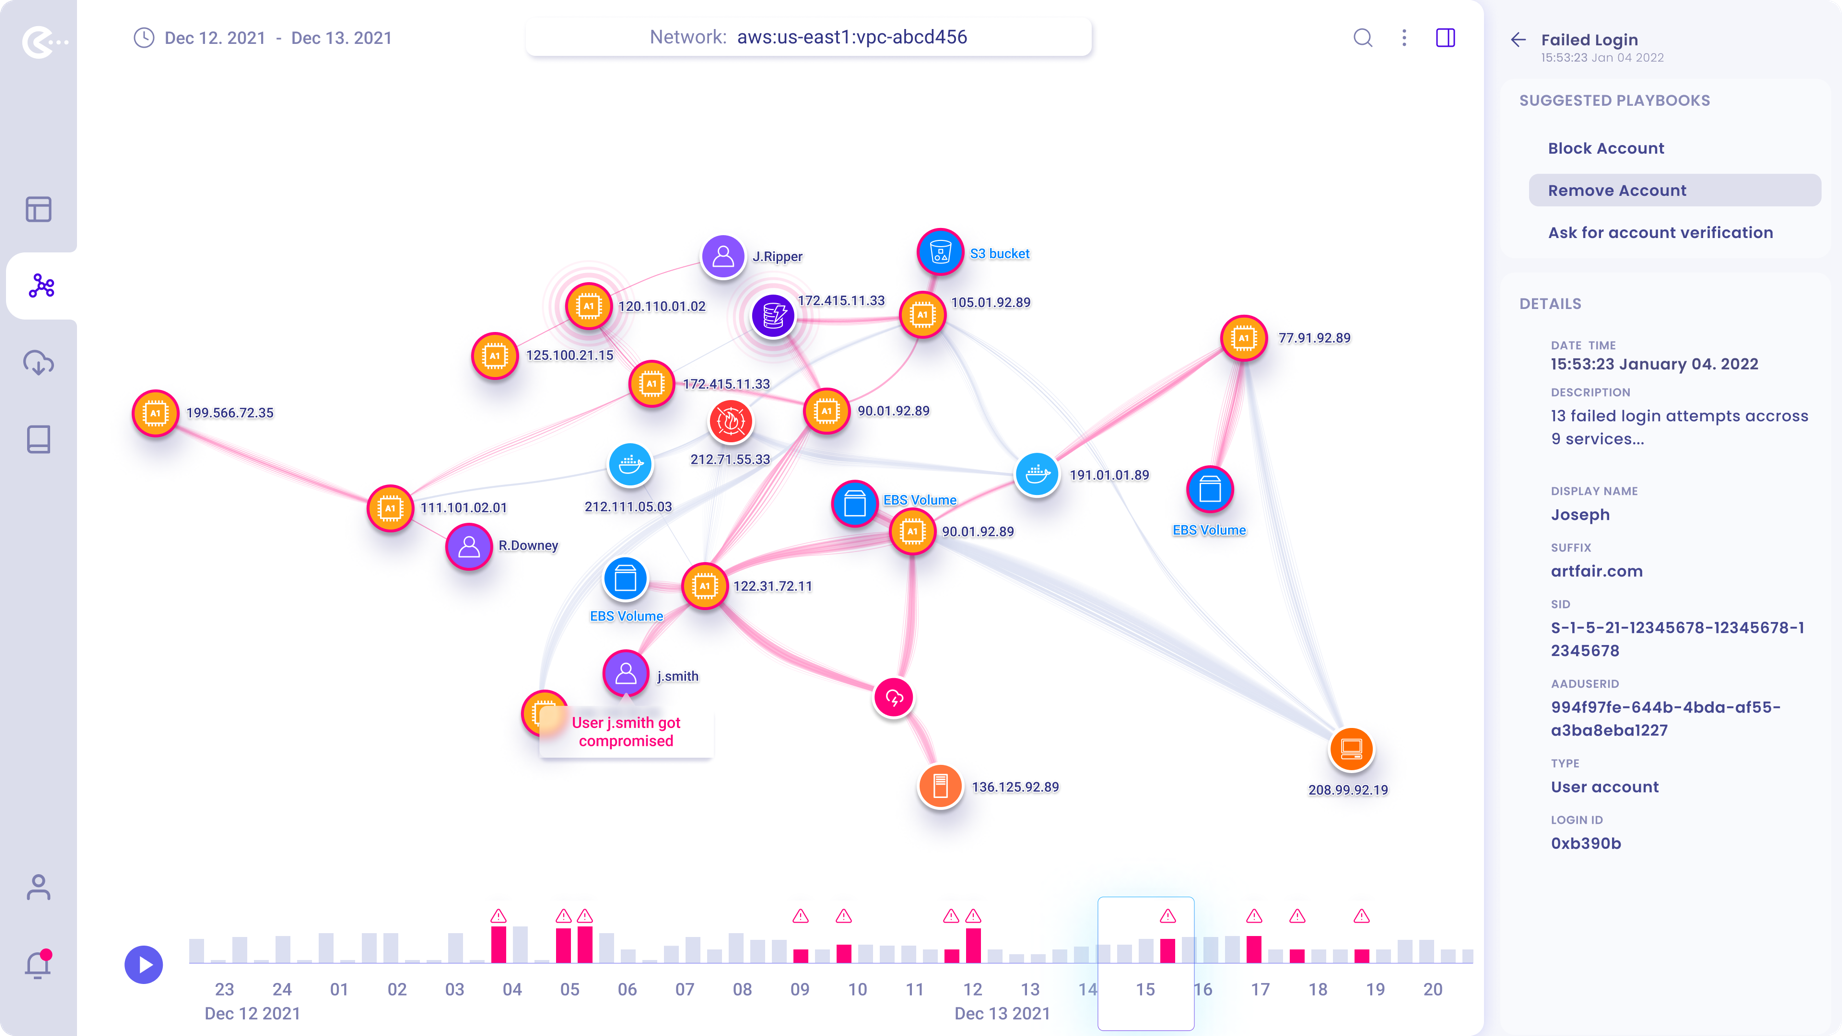
After the user selected a particular threat to remediate, suggested actions “PlayBooks” and threat details displayed in the panel.
Users can navigate back to the full threat list if needed.
Selecting a suggested action will offer subsequent options to remediate the threat.
Testing the selected PlayBook
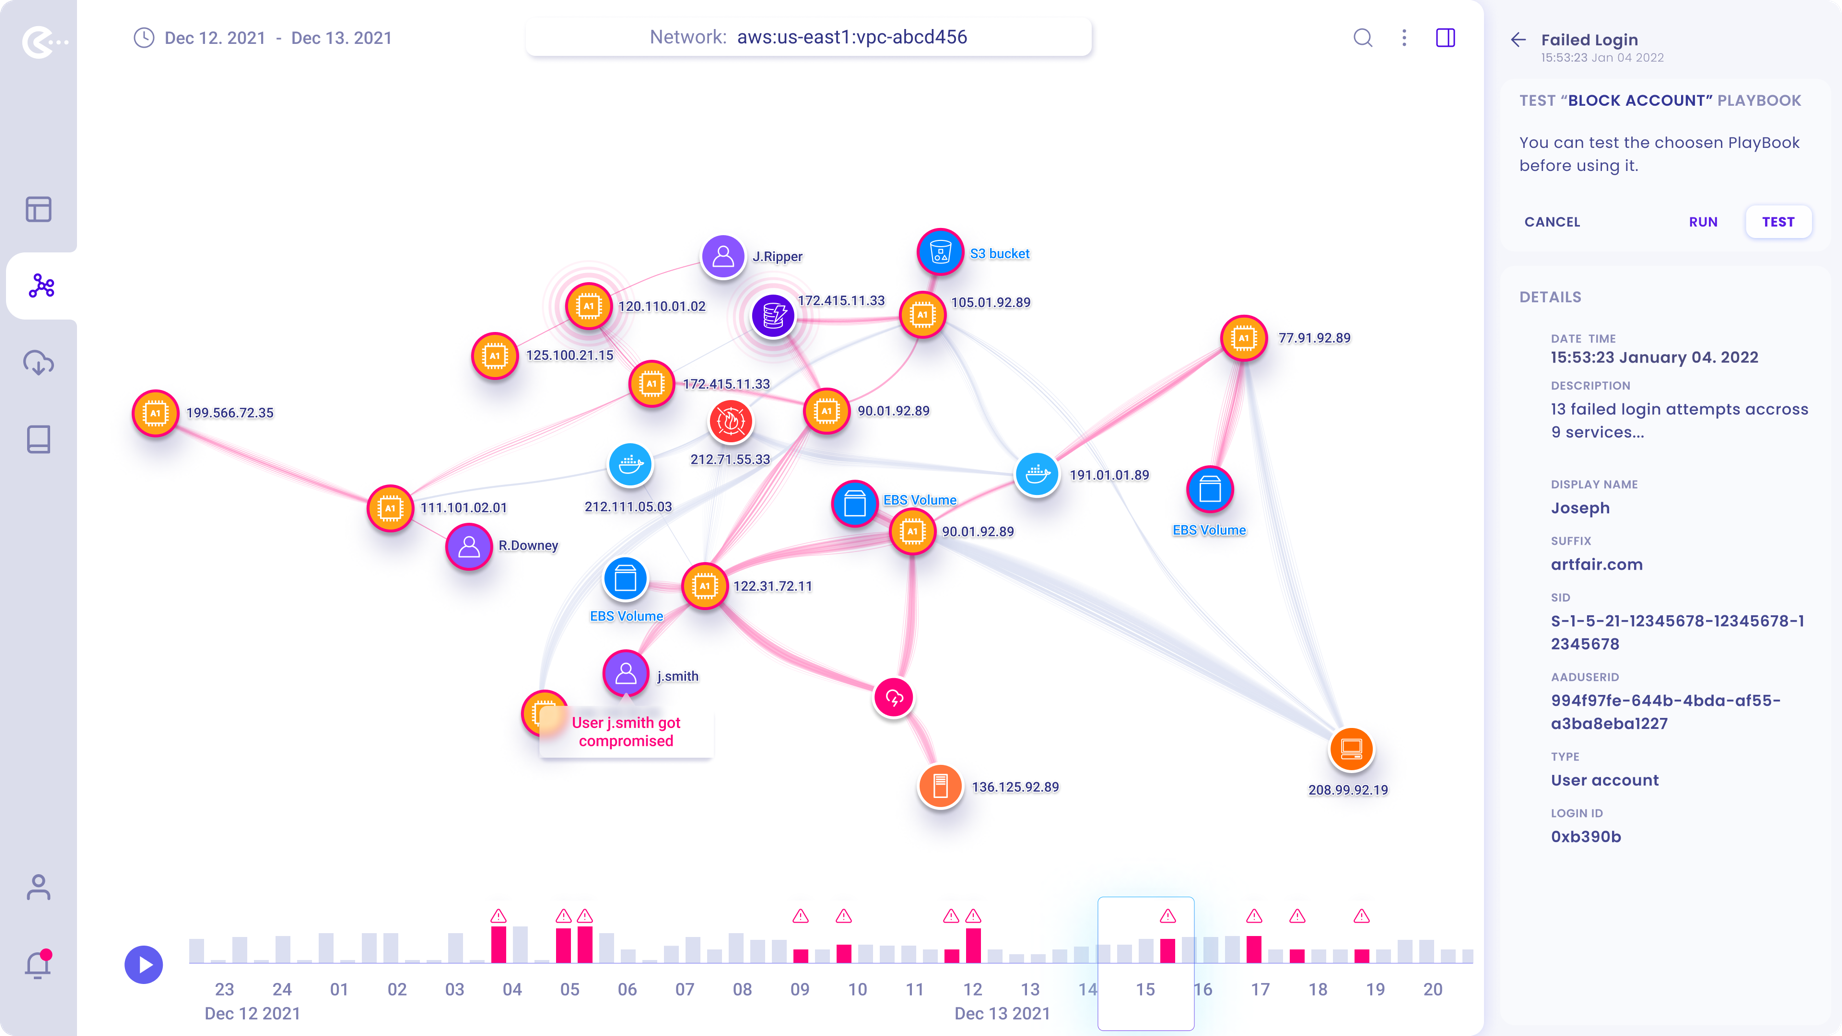
Users can choose to either “Run” or “Test” the effect of the selected PlayBook to see if it will achieve the desired results.
If PlayBook is tested the graph will visually display the effects on the graph.
In this example, the PlayBook is tested before the user commits to run it.
PlayBook test result / Run PlayBook Action
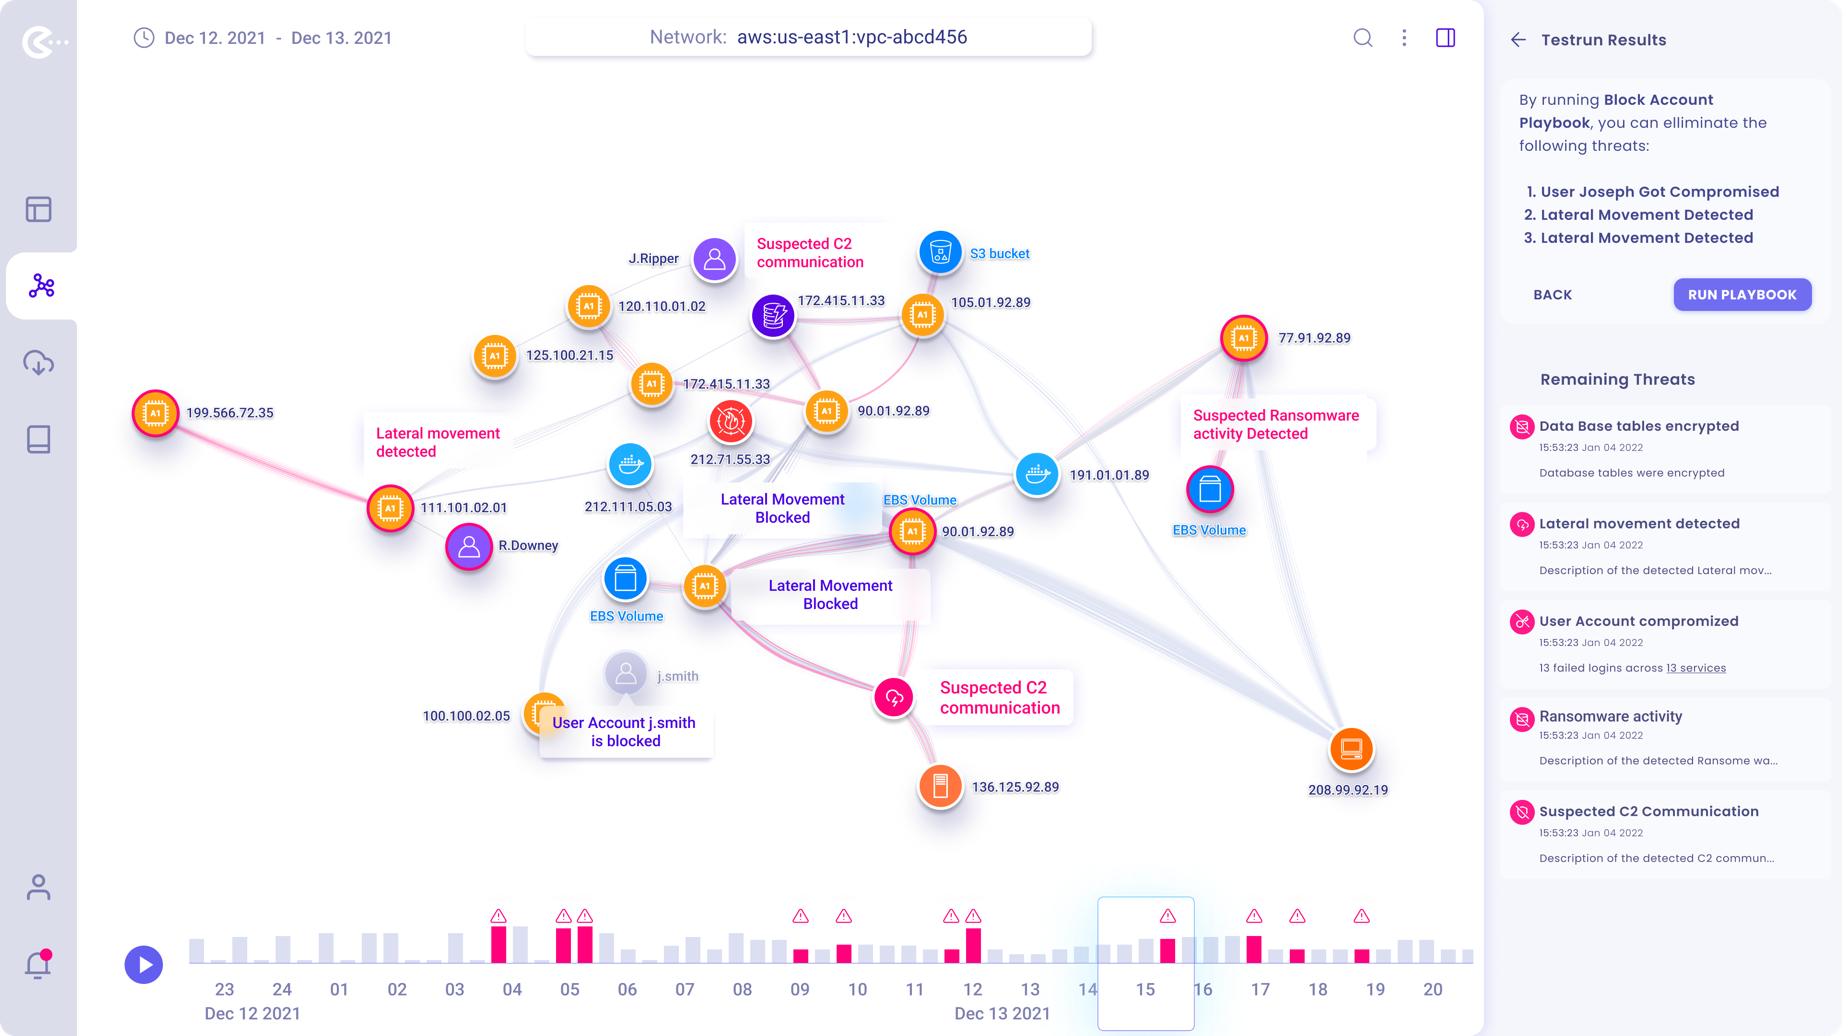
After PlayBook is tested, the user can read the list of eliminated threats and the remaining threats. in the panel. The operator can also see the PlayBooks effect visualized on the network graph.
She/He has the choice to run the PlayBook or to go back to the chronological list of threats.

Copyright © 2022 Peter Budavari. All rights reserved.